Speed of a Racing Car
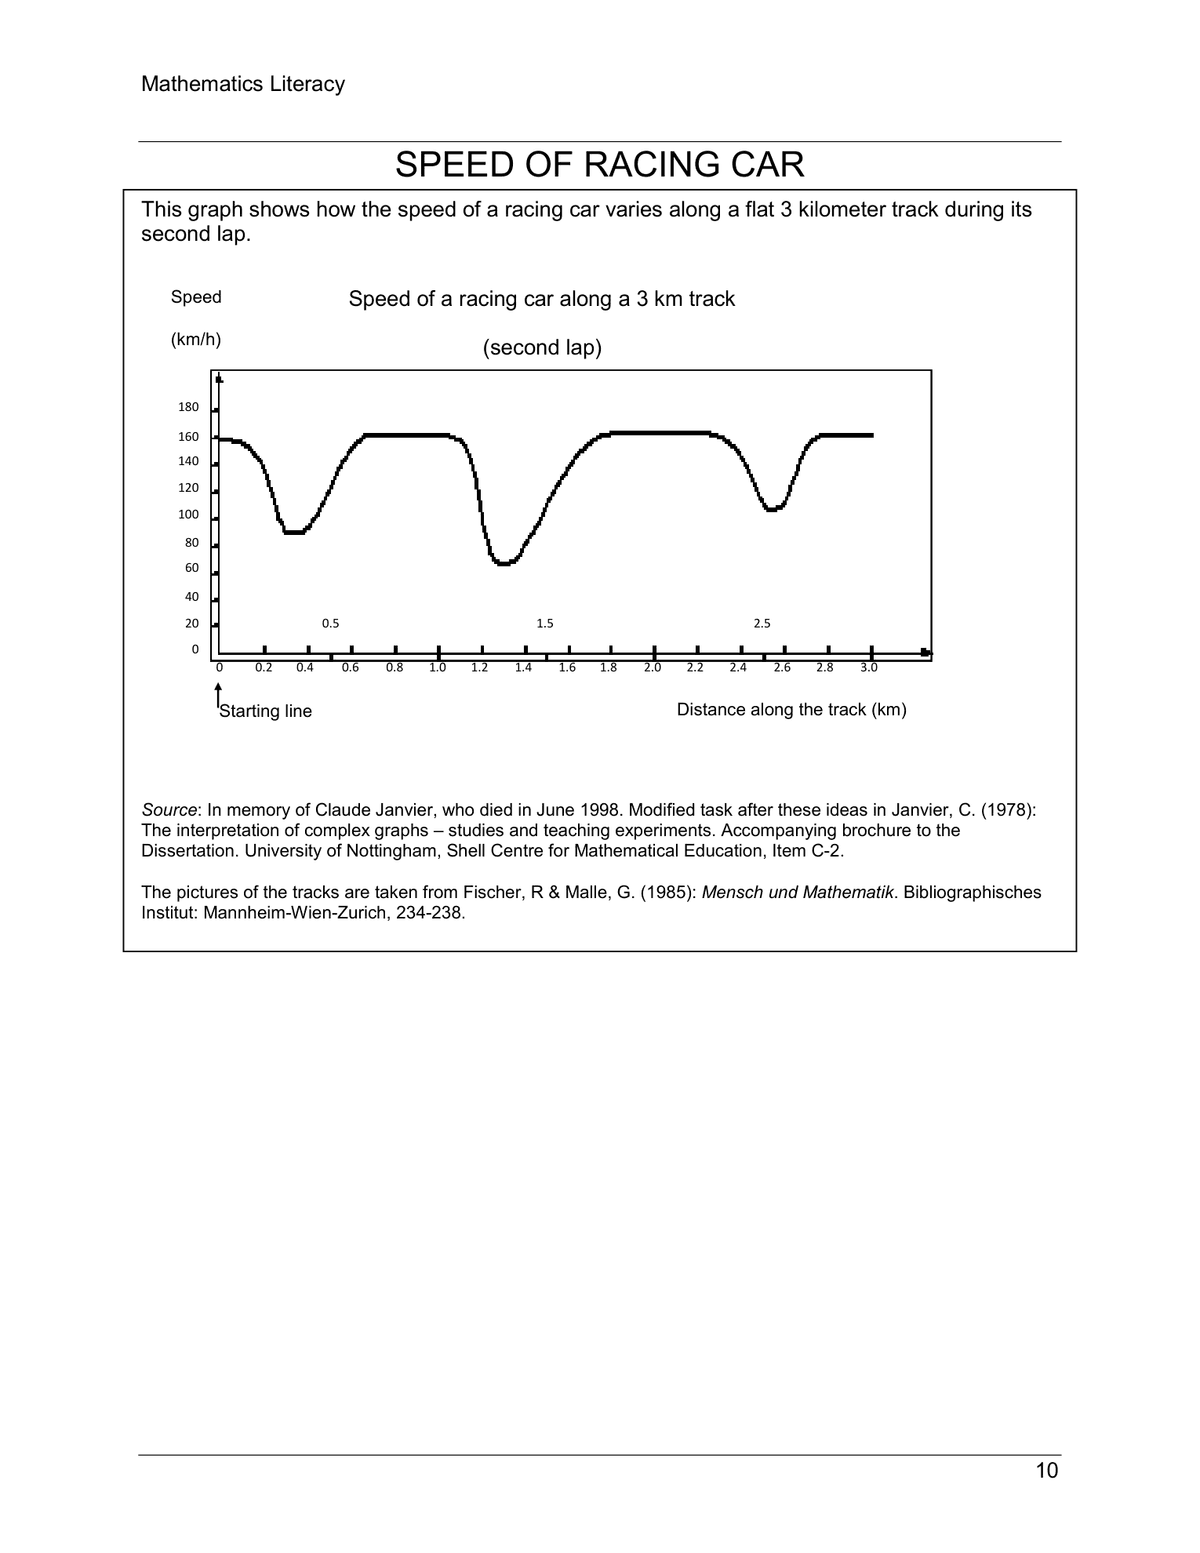
The graph shows how the speed of a racing car varies along a flat 3 kilometre track during its second lap. The horizontal axis shows distance along the track in km, and the vertical axis shows speed in km/h.
Question 1 of 3
What is the approximate distance from the starting line to the beginning of the longest straight section of the track?
Speed of a Racing Car
The graph shows how the speed of a racing car varies along a flat 3 kilometre track during its second lap. The horizontal axis shows distance along the track in km, and the vertical axis shows speed in km/h.